We call it plotting linear functions, we may call it plotting line graphs, we may also call it drawing graphs. You may also call it y = mx + c. There are many different ways that we can call plotting linear functions. However not many of these ways mean anything to our learners. Yes we could loosely and tentatively link in English and explore the language of plotting linear and define the term functions. After we define the words, use a thesaurus, come up with synonyms and then devise our own definition and then create our own lesson objectives we have probably used a full hour?!
This might be a nice activity but actually it's not going to help with the knowledge that we need in the first instance because when we start teaching this topic what were actually teaching them to do is complete tables of values. I appreciate you may not teach it this way but this seems to be the way I have seen it or across many different schools. And when were completing a table of values again we're calling it something that means nothing to our learner's. This whole idea came from the excellent Will Emery http://www.greatmathsteachingideas.com/ . It was Will who said why do we call it table of values when actually it's a table of coordinates? And it was that simple changing language that cracked it for me with the bottom set year 8 in a school I was in that all of a sudden could plot linear functions. Which is why I'm a great advocate of finding a different way to say something to remove are complicated mathematical language where appropriate. Yes I still call it prime factor decomposition and yes I will still refer to this as plotting linear functions and completing the table of values but my lesson objectives will refer to completing tables of coordinates. Because as in the blog post that I read from Will Emery that is essentially what they're creating a table of coordinates. Just such a simple language change makes all the difference.
Once we have called it a table of coordinates we may not be good to go, as I learned! Think of the typical question, something like “plot the table of values for the function y=2x+3 for the values of x -5 to 5.” Channelling Will Emery’s post it it struck me that actually if you start with the positive end of the table of coordinates (values) you can spot the linear pattern and then complete the negative values. In the function y = 2x + 3 for the values of x -5 to 5 ,
I would substitute in 5 first 5 x 2 is 10 + 3 13.
Then I would substitute in for 4 x 2 is 8 + 3 is 11
Then I was substituting 3 so 3 x 2 is 6 plus 3 is 9.
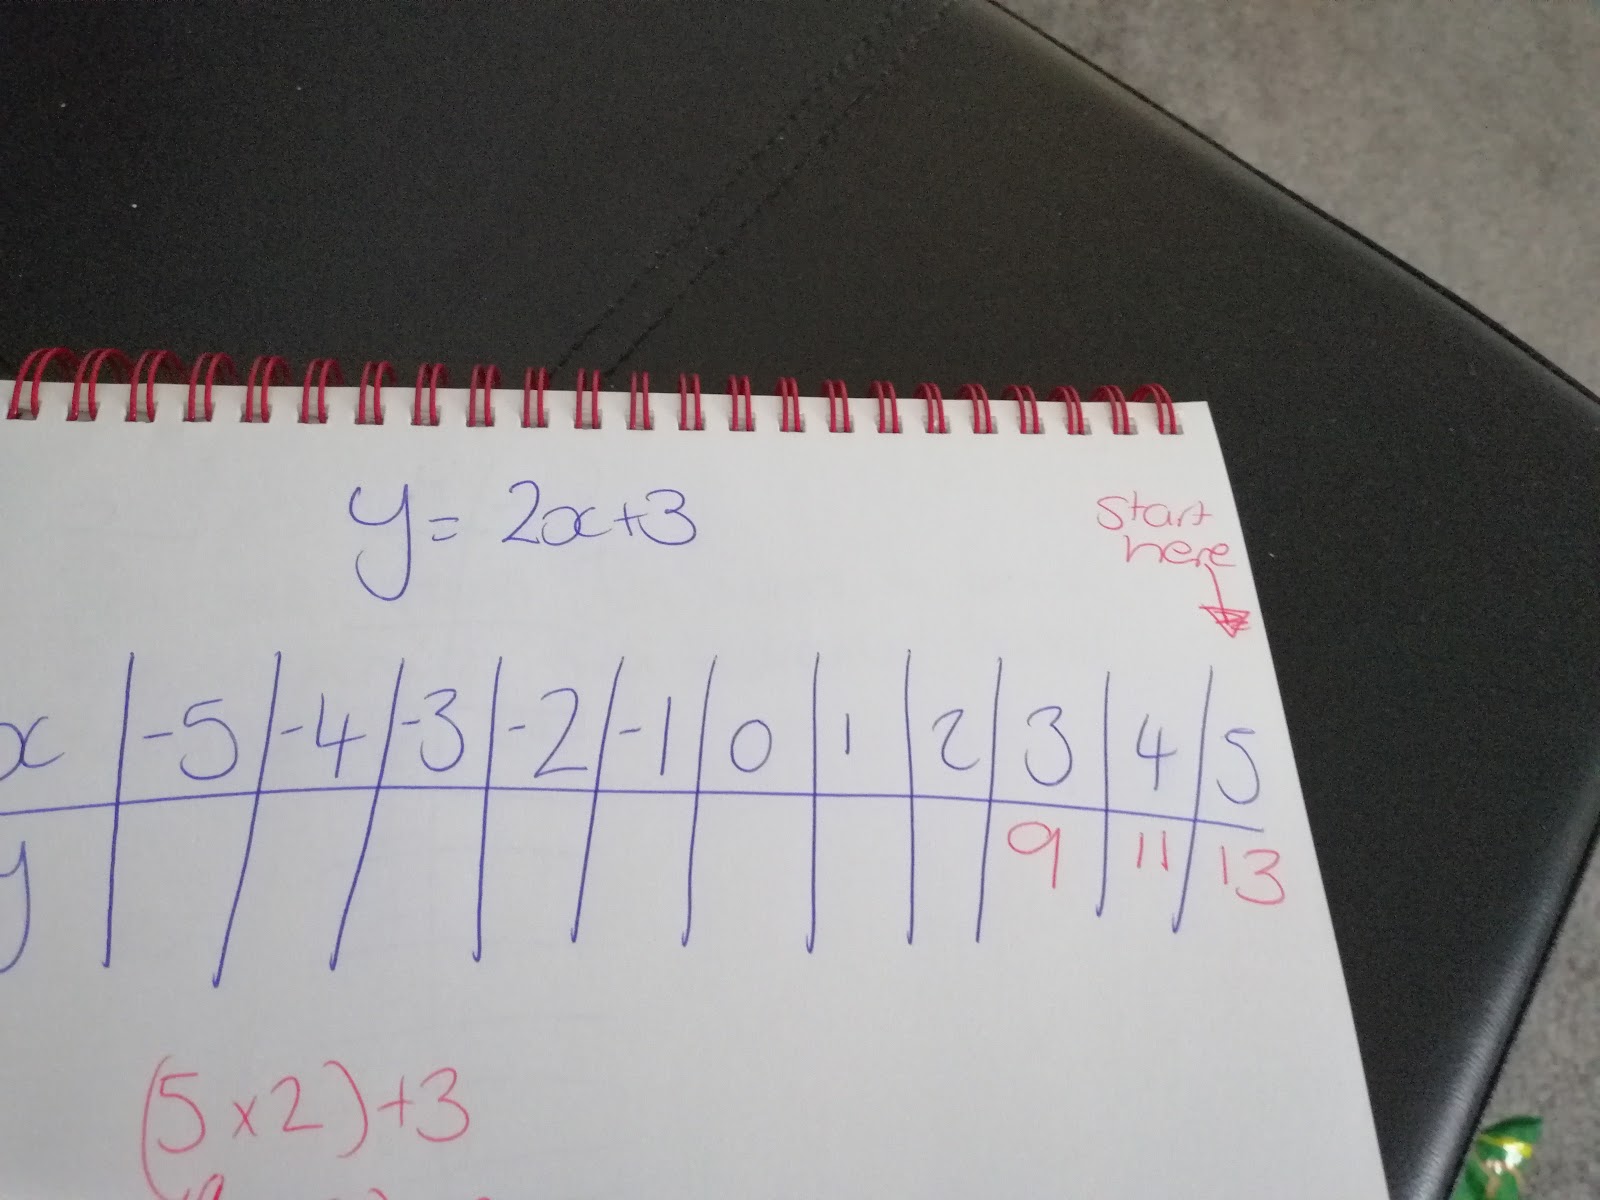
I can now see a pattern in that is going down by two. I can now complete the rest of the table of values without having to actually multiply negative numbers by continuing the pattern. Yes multiplying with negative numbers is important. I would always encourage students to check that they are correct my substituting in negative numbers. But if you think about what we are trying to achieve in this lesson, it is to plot functions, not multiply negative numbers. I am aware that these skills should be secure and should time allow I would love to recover and remain on negative numbers until the were secured. However, I prefer to look at and explore why a linear function generates a linear sequence rather than focus on the practical application of multiplying negative numbers which may not be secure knowledge for learners. Once they have discovered the pattern, we can then ask why is there a pattern and explore algebra through the interest that plotting linear functions has generated.

